
 Jakob Görgen
—
Tue, Aug 13, 2024
Jakob Görgen
—
Tue, Aug 13, 2024
SimBricks simulations can provide almost arbitrary visibility into systems without affecting system behavior at all, unlike in physical systems. Detailed logging is one of the key features of most simulators. However, for a user, making sense of these logs, especially once multiple communicating system components are involved, is a slow and painful process. To make this easier and provide full system insights across components, we combine SimBricks simulations with distributed tracing tools. This combination enables users to perform detailed analysis of performance bottlenecks, causal relationships, and data & control flow propagation, all across multiple hardware and software components.
Understanding Modern System Performance is Challenging
Today’s performance-critical systems build on increasingly specialized hardware and software components, often with complex and sub-microsecond interactions. The impact of these interactions on the bottom-line performance of the complete system is almost impossible to predict based on simple system models. Even when physical testbeds are available, the overhead for collecting sufficiently fine-grained measurements at different components is prohibitive and substantially affects system behavior. As a result, deep visibility into low-level interactions is out of reach in physical testbeds.
Simulations Provide Visibility Without Affecting Systems
One of the key advantages of simulations arises from the decoupling of timing on the host and the simulated system. Simulators may use very detailed and costly models for the simulated system, but since the simulator also controls the perceived time for the simulated system we can simulate systems with arbitrary performance characteristics. As a consequence, simulators typically offer configuration options to provide very detailed logs directly in the simulator which do not affect the simulated system at. Often, simulations with detailed logs take much longer to run because of the logging overhead, but the simulated system behaves identically to a simulation without logging. Used in SimBricks, this enables users to collect detailed logs from multiple simulators simulating different system components while simulating a workload of interest. Since SimBricks synchronizes simulator clocks, log files have global timestamps that a user can accurately correlate across components.
Making Sense of Too Much Disaggregated Log Data
Even with global timestamps, SimBricks users face a substantial challenge in making sense of the massive amounts of data generated in separate per-component logs and simulator-specific formats. To solve this we look to distributed systems and their established tooling for system-wide visibility. Specifically, Distributed tracing enables the reconstruction of request journeys across distributed systems, for performance optimization and troubleshooting. Distributed tracing systems also aggregate log information from multiple sources into full system traces, and provide tooling for analyzing these traces through querying and visualization.
Simulation + Distributed Tracing = Deep System Insights
With Columbo, we set out to build a solution to combine distributed tracing with SimBricks simulations to provide users with detailed end-to-end system traces. These allow users to analyze the performance of a system simulated in SimBricks by providing end-to-end visibility, e.g. including hosts, NICs, and network with the entire software stack. SimBricks simulations provide (almost) arbitrarily detailed logs. Columbo ingests these simulator-specific logs, transforms them into a uniform format of timestamped events, and leverages a user-specified configuration to correlate events across components into full-system traces. Columbo then exports these traces through the standardized open telemetry API to distributed trace analysis tools such as Jaeger for the user to analyze:
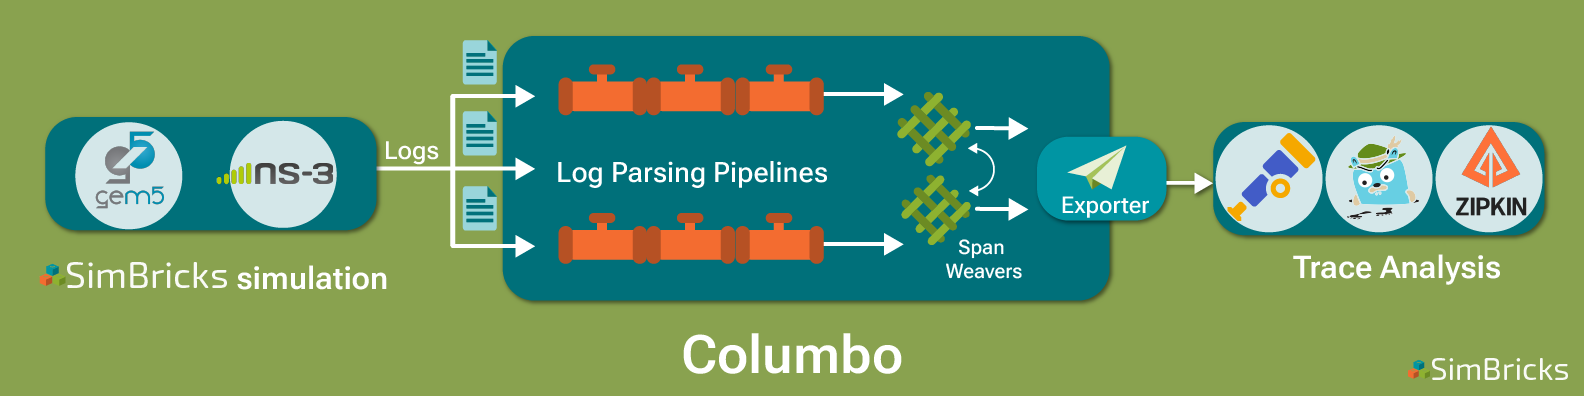
Columbo: Aggregating Massive Simulator Logs into Traces
Efficiently aggregating the massive amounts of generated log data is a challenge. Columbo tackles this with a stream processing architecture comprising multiple parallel pipelines:

First, simulator-specific pipelines read and parse log files to create event streams. For efficiency, users can configure early filtering here. Additional event processors abstract event streams into standardized formats. Next, these event streams pass through the SpanWeavers responsible for grouping events into spans and correlating events from different pipelines across components. To this end, SpanWeavers communicate to make causal connections between spans created from different simulator log files. Once completed, SpanWeavers forward the generated traces for export to the distributed tracing tool.
From there, users can then rely on a sophisticated and mature set of distributed tracing tools for analysis, visualization, and further processing. If you would like to know more, check out our recent vision paper or reach out to us directly:


